MC2-Project-2
Contents
- 1 Updates/FAQs
- 2 Overview
- 3 Template
- 4 Time Period and Stock for Testing
- 5 Part 1A: Bollinger Band Strategy Chart (15%)
- 6 Part 1B: Bollinger Band Strategy Backtest (15%)
- 7 Example Results
- 8 Part 2: Your Strategy (70%)
- 9 Contents of the Report
- 10 Hints and resources
- 11 Extra Credit (up to 2%)
- 12 What to turn in
- 13 Rubric
- 14 Required, Allowed & Prohibited
Updates/FAQs
2016/2/29:
- FAQ and project description overhauled. If you've already started on the project be sure to reread this, some important items have changed.
- Q: Do we show all entry and exit signals or just the ones that are actually relevant for our current positions? For example, if there is an exit signal but we don't hold a position that would be exited yet do we show it on the chart? A: Only show the ones relevant to your current positions.
- Q: Is the IBM price between Dec 2007 and Dec 2009 the only information I have for my strategy? A: You should use only the data available to you in the "/data" directory provided, which is open, high, low, close, adjusted close, and volume.
- Q: Does this mean that we will have a single asset portfolio? and with only 100 (long/short) shares at any given time? A: Yes
- Q: What should we do if there is a buy signal, followed again by a buy signal? A: You should hold one position until exit. So you should ignore the second buy signal.
- Q: Do I have to use the provided data for this project? A: Yes, you must use the provided data.
- Q: Can I use data before Dec 31, 2007? A: For Part 1, no, you can only use data from Dec 31, 2007 to Dec 31, 2009.
- Q: Should we use $SPX or SPY as the benchmark? A: SPY.
Overview
In this project you will develop trading strategies using Technical Analysis, then test them using your market simulator.
In this project we shift from an auto graded code format to a report format. For this project your grade will be based on the PDF report you submit, not your code. However, you will also submit your code that will be checked visually to ensure it appropriately matches the report you submit.
Template
Create your code within a directory named ml4t/mc2_p2/. Within that directory you should create two python programs as follows:
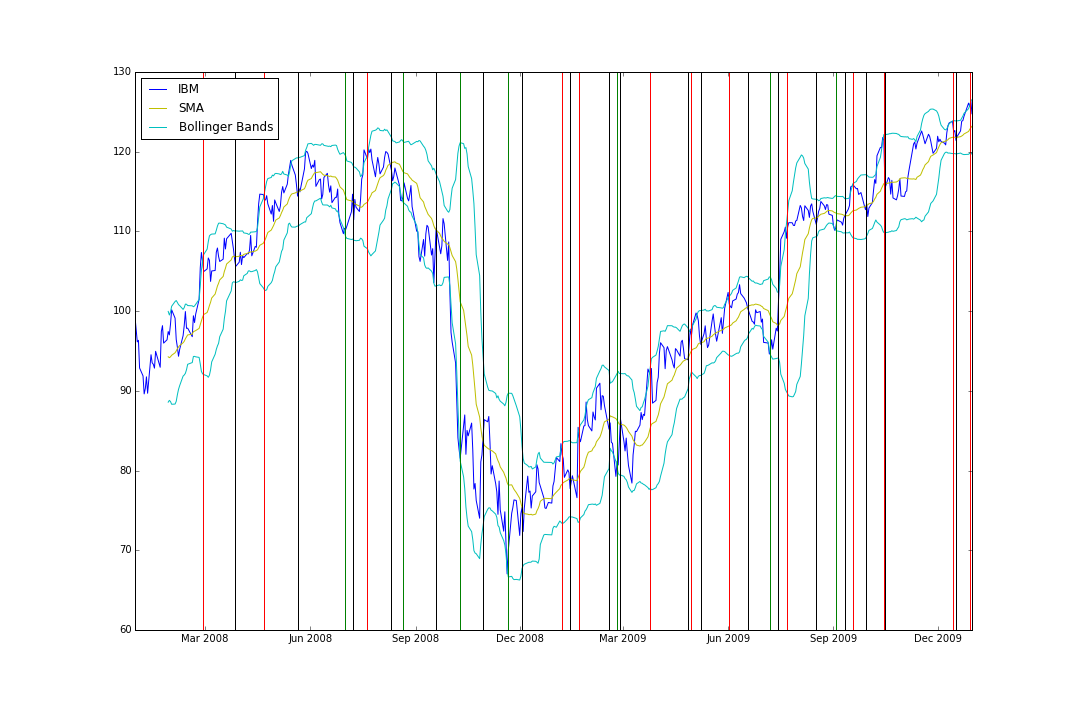
- bollinger_strategy.py: This code should generate a .png chart that illustrates the bollinger bands, and entry and exit points for a bollinger-based strategy.
It should also generate an orders.csv file that you feed into your market simulator to backtest the strategy.
- my_strategy.py: This code should generate a .png chart (or charts) that illustrate the clever strategy you develop, along with indications of entry and exit points. It should also generate an orders.csv file that you feed into your market simulator to backtest the strategy.
You will submit all of the above code files along with your PDF report.
Time Period and Stock for Testing
We will use IBM and trade it from December 31, 2007 until December 31, 2009. Note that the first trade cannot occur until 20 days after December 31, 2007 because the first value for Bollinger bands is not available until then.
Part 1A: Bollinger Band Strategy Chart (15%)
If you don't know about Bollinger Bands already, go learn about them. Here are some references:
- http://stockcharts.com/school/doku.php?id=chart_school:technical_indicators:bollinger_bands
- https://en.wikipedia.org/wiki/Bollinger_Bands
Here are the essential things you need to know and to implement them. In addition to the price of a stock over time, Bollinger Bands include:
- 20 day simple moving average (SMA) line.
- Upper Band = SMA + 2 * 20 day standard deviation.
- Lower Band = SMA - 2 * 20 day standard deviation.
A basic Bollinger Band trading strategy works as follows: There are two potential entries, long and short. The long entry is made when the price transitions from below the lower band to above the lower band. This indicates that the stock price has moved substantially away from the moving average, but is now moving back towards the moving average. When this entry signal criteria is met, buy the stock and hold it until the exit. The exit signal occurs when the price moves from below the SMA to above it.
The short entry and exit are mirrors of the long entry and exit: The short entry is made when the price transitions from above the upper band to below the upper band. This indicates that the stock price has moved substantially away from the moving average, but is now moving back towards the moving average. When this entry signal criteria is met, short the stock and hold it until the exit. The exit signal occurs when the price moves from above the SMA to below it.
You should create a chart that shows:
- Stock price (adjusted close)
- SMA
- Upper Band
- Lower Band
- Long entries as a vertical green line at the time of entry.
- Long exits as a vertical black line at the time of exit.
- Short entries as a vertical RED line at the time of entry.
- Short exits as a vertical black line at the time of exit.
Part 1B: Bollinger Band Strategy Backtest (15%)
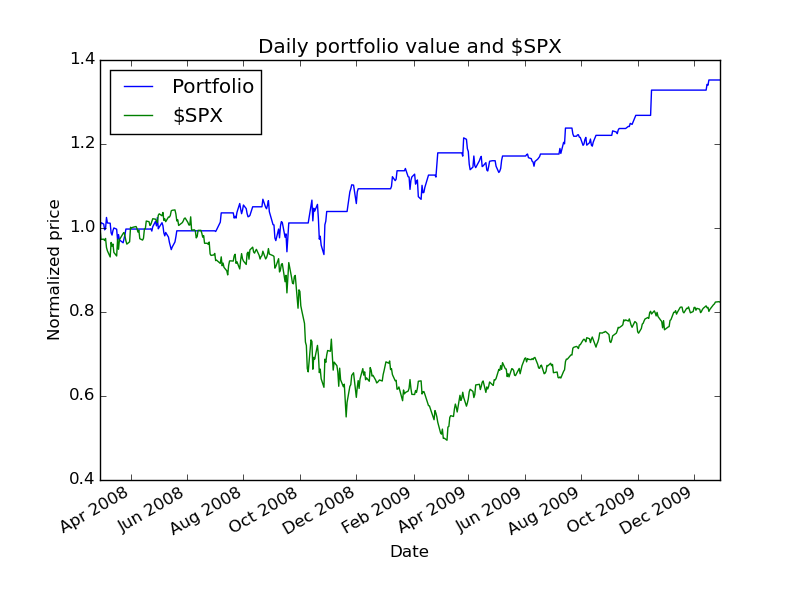
Reuse your charting code to generate trades. Start with $10,000. For a long entry, BUY 100 shares and hold until the exit. For a short entry, SELL 100 shares and hold until the exit. Chart the performance of your fund over the time period described in "what to turn in" below.
Example Results
Data Range: 2007-12-31 to 2009-12-31

Sharpe Ratio of Fund: 0.97745615082
Sharpe Ratio of $SPX: -0.21996865409

Cumulative Return of Fund: 0.3614
Cumulative Return of $SPX: -0.240581328829

Standard Deviation of Fund: 0.0108802922269
Standard Deviation of $SPX: 0.0219524869863

Average Daily Return of Fund: 0.000669942567631
Average Daily Return of $SPX: -0.000304189525556
First few trades:
2008-02-28    IBM  SELL     100
2008-03-27    IBM   BUY     100
2008-04-22    IBM  SELL     100
2008-05-21    IBM   BUY     100
2008-07-01    IBM   BUY     100
2008-07-08    IBM  SELL     100
Part 2: Your Strategy (70%)
For this component of the project you are to devise your own Technical Analysis-based signal. You should write code to create a chart that shows relevant information about the indicator, including long and short entry and exit events. Your strategy should outperform the Bollinger Band strategy described above (in terms of cumulative return).
Contents of the Report
Your report (PDF -- do not even think of submitting a Word document) should contain the following elements:
Part 1:
- Bollinger Band strategy chart.
- Bollinger Band strategy backtest chart.
- Summary of Bollinger Band backtest performance metrics.
Part 2:
- Written description of your strategy idea. You will be graded on the clarity of your description and also on how compelling an idea it is.
- Chart or charts that illustrate your strategy idea. At least one of the charts should be similar to the Bollinger Band strategy chart.
- Backtest chart of your strategy.
- Analysis of the performance of your strategy idea over the 2008-2009 period. Note that your strategy should outperform the Bollinger Band strategy.
- Summary of backtest performance metrics.
Hints and resources
Consider augmenting the Bollinger Band strategy with additional consideration of the SPY's Bollinger values. If the individual stock is substantially different, this could signal an important move for the stock.
Extra Credit (up to 2%)
(Separate PDF report submission)
Address the following issues. What do you think of refining and testing your strategy over the same 2 years? Is that a good practice? Why or why not? Test your strategy in years before and after 2008-2009. Does the strategy continue to work well in those time periods? Why?
Submit a single document, report.pdf to the "extra credit" assignment on t-square.
What to turn in
Be sure to follow these instructions diligently!
Via T-Square, submit as attachment (no zip files; refer to schedule for deadline):
- Your code as bollinger_strategy.py, my_strategy.py
- Your report as report.pdf
Unlimited resubmissions are allowed up to the deadline for the project.
Rubric
- Bollinger Band entry/exit graph correct: 7.5%
- Bollinger Band code is correct: 7.5%
- Bollinger Band strategy performance graph correct: 7.5%
- Bollinger Band strategy results correct: 7.5%
- Written description of student's own strategy:
- Clarity: 10%
- Compelling idea (is there a logical reason to believe this strategy?): 10%
- Student's strategy code correct: 10%
- Chart(s) supporting student's strategy:
- Does the chart convey the idea of the student's strategy? 10%
- Does the student's strategy outperform the Bollinger Band strategy? 10%
- Backtest of strategy:
- Is the chart correct? 10%
- Are results reported and are they plausible? 10%
Required, Allowed & Prohibited
Required:
- Your project must be coded in Python 2.7.x.
Allowed:
- You can develop your code on your personal machine, but it must also run successfully on one of the university provided machines or virtual images.
- Your code may use standard Python libraries.
- You may use the NumPy, SciPy, matplotlib and Pandas libraries. Be sure you are using the correct versions.
- You may reuse sections of code (up to 5 lines) that you collected from other students or the internet.
- Code provided by the instructor, or allowed by the instructor to be shared.
Prohibited:
- Any libraries not listed in the "allowed" section above.
- Dead parrots.
- Any code you did not write yourself (except for the 5 line rule in the "allowed" section).
- Any Classes (other than Random) that create their own instance variables for later use (e.g., learners like kdtree).

